Why are SII and Percentile indispensable in your fitting software?
The Speech Intelligibility Index (SII) gauges the portion of a speech signal audible to a listener. It serves as a valuable tool during hearing aid fittings, providing patients with insights into the availability of speech with or without aids. Additionally, it helps assess whether the aids offer an appropriate level of audibility, prompting adjustments if needed. SII, a percentage between 0% and 100%, correlates with speech intelligibility. For example, an SII score of 25% suggests roughly half of the speech is intelligible, while 80% predicts most of it will be. The aided SII is calculated by comparing individual hearing thresholds to the aided response curve recorded via real ear measurement (REM) using the Maestro software.
Another useful tool is the Percentile Analysis feature, represented by the 30th and 99th percentile curves. These curves define the range where more than 30% and less than 99% of the input speech signal was recorded during measurement. They help illustrate how hearing aids modify the level range of speech signals at different inputs, confirming visually that peaks stay within the patient's comfort level and valleys are audible above the patient's threshold.
Available in Maestro software for REM and coupler measurements, these advancements solidify the Inventis Trumpet real-ear measurement system as a crucial first step toward improving patients' hearing journeys. Refer to Figure 1 and Figure 2 in the Maestro software for a visual representation of these features.
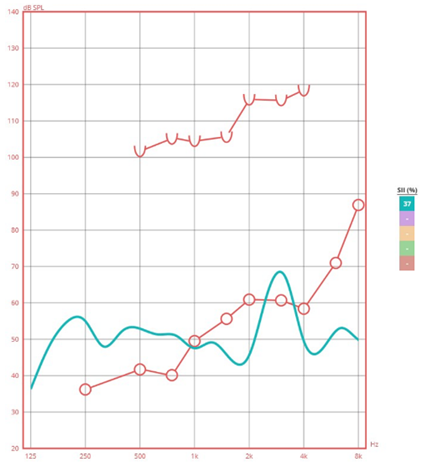
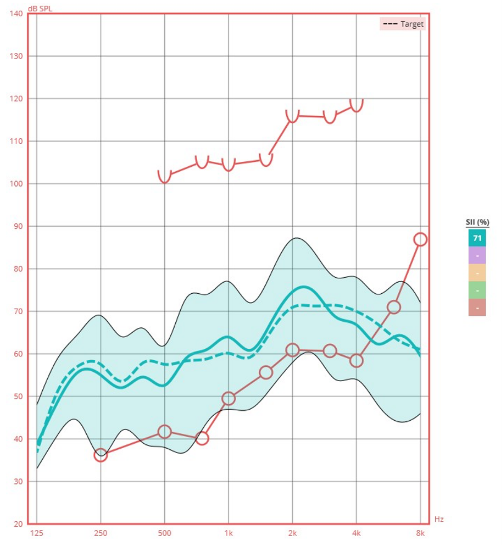
Comparing Figure 1 and Figure 2 reveals the shift in SII post-amplification, from an unaided SII of 37% to an aided SII of 71%.
* The content has undergone a slight revision by the Academia editorial team.

Anna Scala
Anna received her specialization in Biomedical Engineering from Padua University. She has worked as technical-data processing consultant, healthcare sector, for several years. At Inventis, as Education Manager, she is in charge of the company’s educational programs as well as of the scientific divulgation events for clinicians and audiologists.

 International - English
 Italia - Italiano
 France - Français
 USA - English